PageSpeed Insights Score by Google, how to understand?
Are you having a hard time understanding Google PageSpeed Insights? Would you love to speed up your website?
Since you are already here, it’s almost silly to ask these questions.
Way back in 2010, Google introduced us to a couple of website performance optimization tools, and amongst them was Google PageSpeed Insights. Ever since its inception, PageSpeed Insights (PSI) has helped site owners, webmasters, and developers analyze website performances. It is an online tool where you simply enter your website credentials and voila, you get a whole list of data, diagnostics, and opportunities. It lets you know what is working for your website and what’s not working, leaving room for improvement. You can access this tool on any browser and analyze your PageSpeed Insights Score on a scale of 0-100.
Why do you need PageSpeed Insights?
So you have a website up and running. You are working your fingers to the bone to create the best content. Your audience is growing but not at a very jaunty pace. There’s still something missing from the equation, you can feel it but cannot put your finger on it. Well, have you run it by PageSpeed Insights yet? If not, do it right away!

PageSpeed Insights scores a website on a scale between 0 to 100 with 0-49 marked as slow (red), 50-89 as moderate (orange), and 90-100 as fast (green). These scores simply indicate how fast your website is loading up based on a number of best-performing metrics used by Lighthouse. Lighthouse is an automated tool developed by Google to improve the quality of web pages. Search engines like Google employ ranking algorithms that are directly affected by the page’s loading speed. If you want better placement for your web page, you need to understand these metrics and make the best of the optimizations.
All about PageSpeed Insights and Lighthouse

As mentioned above, PageSpeed Insights scores are calculated through Lighthouse and it factors in everything from accessibility, SEO, performance to web apps and so much more. It measures the performance on both desktop devices as well as mobile devices. Here’s what it has to offer- Lab Data, Field Data, Opportunities, Diagnostics, and Passed Audits.
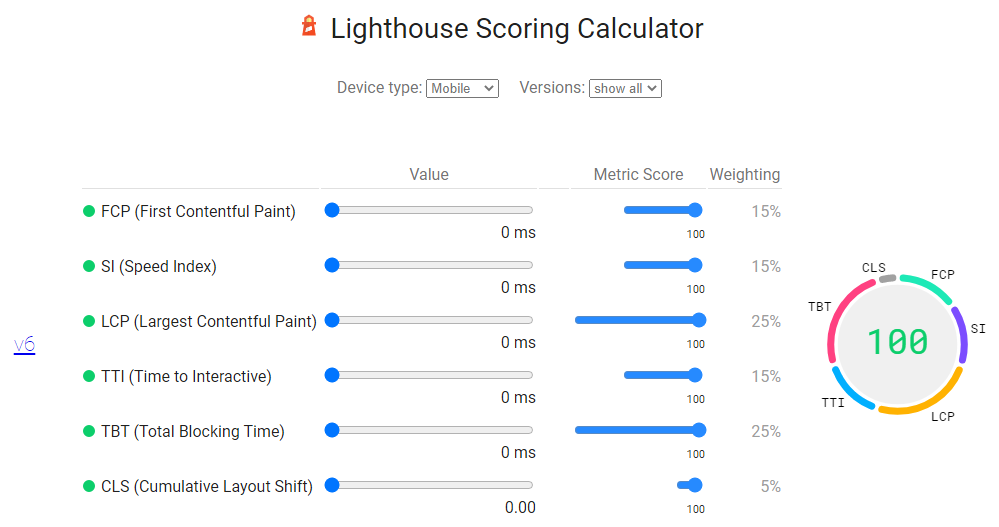
- Lab Data: Lab data shows specific information for a page load. Since it is collected in a controlled environment, lab data is useful for debugging performance issues. It used First Contentful Paint (FCP), Largest Content Paint (LCP), Speed Index (SI), Cumulative Layout Shift (CLS), Time to Interactive (TTI), and Total Blocking Time (TBT). FCP marks the first point of page load timeline when the user first sees content on his screen while LCP is the point when the main content is likely to be loaded completely. Speed Index shows how fast the contents of a page are visible, CLS shows how often users experience layout shifts. TTI is the time it takes a page to load completely while TBT is the total time between FCP and TTI. It is divided into three categories- good, needs improvement, and poor. Needless to say, it fails to capture real-world experiences.
- Field Data: Field data, as the name suggests, is used to collect real-world user experiences and compares your website with others for the last 30 days. To do this, it uses Chrome User Experience Report (CrUX) to analyze key user experiences across the web. Based on this, it will line up the First Contentful Paint (FCP), Largest Contentful Paint (LCP), First Input Delay (FID), and Cumulative Layout Shifts (CLS). FID signifies the user experience when forced to interact with non-responsive pages. FCP, LCP is used to measure perceived load speed, FID is used for load responsiveness while CLS is used for measuring visual stability. For best results, PageSpeed Insights recommends a low FID, CLS, and a fast FCP, LCP. PageSpeed Insights uses Core Vitals to measure how well a page fares in terms of field data and uses three buckets to classify them- poor; needs improvement; good.
- Audits: Lighthouse performs three types of audits- Opportunities, Diagnostics, and Passed Audits. Opportunities indicate recommendations/suggestions that could improve your website metrics and help it load faster. These might include removing unused CSS, eliminating render-blocking resources among many other solutions. Each opportunity also indicates how it will impact the load time if implemented.
Diagnostics provide information about the best web practices and how well your page adheres to them. It could be anything from minimizing main-thread work to avoiding large layout shifts.
Lastly, passed audits show the audits that have been passed by your page. These are the performance metrics that your website already checks out on and does not need any intervention.
Making the best PageSpeed Insights
Believe it or not, there’s a whole lot of chemical balance needed between page size, load time, conversion rate, and what not to improve your website’s speed. It is simply impossible to take care of everything without a little outside help. Google PageSpeed Insights are just what you need if you want to do things perfectly. PageSpeedInsight is easy to use, provides useful data, and also great recommendations. After all, it is quite easy to run a simple test, obtain information about the shortcomings, and do the needful. It is also essential to understand the science behind Google PageSpeed Insights score before taking any major decisions.
Remember, you don’t need a 100/100 PageSpeed Insights score as a measure for your website’s success, a score above 80 is just as good. PageSpeed Insights is simply a tool to help you out when things are not going as planned and you are facing issues with your website speed. It is also an indicator of your website’s health and a way to find cancer. It is a free tool that will give you all the information that you might need to get your website up and running once again. Once you do this, your website will surely fare well and might just race to the top of SERP. A faster website will always be loved by Google, there’s simply no doubt about that. Not just that, PageSpeed Insights scores will also go a long way in improving your SEO. And this goes for the desktop and mobile versions of your website!
With this edifying article, we believe you must have understood how to diagnose your website for issues and ways in which these can be rectified to increase the website’s performance and ultimately increase the PageSpeed Insights score. As mentioned earlier, a high PageSpeed Insights score depicts a fast performing website, and Google loves such websites.
At helpbot our express WordPress Management Services, you will create a new site, change the domain, move to a new hosting provider, or buy new domain names seamlessly without any hassles. We offer our services at different prices to suit your budget accordingly, take a look, and schedule a free call today!


